HOD/LOD/PMH/PML/PDH/PDL Strategy by @tradingbauhaus This script is a trading strategy @tradingbauhaus designed to trade based on key price levels, such as the High of Day (HOD), Low of Day (LOD), Premarket High (PMH), Premarket Low (PML), Previous Day High (PDH), and Previous Day Low (PDL). Below, I’ll explain in detail what the script does:
Core Functionality of the Script:
Calculates Key Price Levels:
HOD (High of Day): The highest price of the current day.
LOD (Low of Day): The lowest price of the current day.
PMH (Premarket High): The highest price during the premarket session (before the market opens).
PML (Premarket Low): The lowest price during the premarket session.
PDH (Previous Day High): The highest price of the previous day.
PDL (Previous Day Low): The lowest price of the previous day.
Draws Horizontal Lines on the Chart:
Plots horizontal lines on the chart for each key level (HOD, LOD, PMH, PML, PDH, PDL) with specific colors for easy visual identification.
Defines Entry and Exit Rules:
Long Entry (Buy): If the price crosses above the PMH (Premarket High) or the PDH (Previous Day High).
Short Entry (Sell): If the price crosses below the PML (Premarket Low) or the PDL (Previous Day Low).
Long Exit: If the price reaches the HOD (High of Day) during a long position.
Short Exit: If the price reaches the LOD (Low of Day) during a short position.
How the Script Works Step by Step:
Calculates Key Levels:
Uses the request.security function to fetch the HOD and LOD of the current day, as well as the highs and lows of the previous day (PDH and PDL).
Calculates the PMH and PML during the premarket session (before 9:30 AM).
Plots Levels on the Chart:
Uses the plot function to draw horizontal lines on the chart representing the key levels (HOD, LOD, PMH, PML, PDH, PDL).
Each level has a specific color for easy identification:
HOD: White.
LOD: Purple.
PDH: Orange.
PDL: Blue.
PMH: Green.
PML: Red.
Defines Trading Rules:
Uses conditions with ta.crossover and ta.crossunder to detect when the price crosses key levels.
Long Entry: If the price crosses above the PMH or PDH, a long position (buy) is opened.
Short Entry: If the price crosses below the PML or PDL, a short position (sell) is opened.
Long Exit: If the price reaches the HOD during a long position, the position is closed.
Short Exit: If the price reaches the LOD during a short position, the position is closed.
Executes Orders Automatically:
Uses the strategy.entry and strategy.close functions to open and close positions automatically based on the defined rules.
Advantages of This Strategy:
Based on Key Levels: Uses important price levels that often act as support and resistance.
Easy to Visualize: Horizontal lines on the chart make it easy to identify levels.
Automated: Entries and exits are executed automatically based on the defined rules.
Limitations of This Strategy:
Dependent on Volatility: Works best in markets with significant price movements.
False Crosses: There may be false crosses that generate incorrect signals.
No Advanced Risk Management: Does not include dynamic stop-loss or take-profit mechanisms.
How to Improve the Strategy:
Add Stop-Loss and Take-Profit: To limit losses and lock in profits.
Filter Signals with Indicators: Use RSI, MACD, or other indicators to confirm signals.
Optimize Levels: Adjust key levels based on the asset’s behavior.
In summary, this script is a trading strategy that operates based on key price levels, such as HOD, LOD, PMH, PML, PDH, and PDL. It is useful for traders who want to trade based on significant support and resistance levels.
Поиск скриптов по запросу "THE SCRIPT"

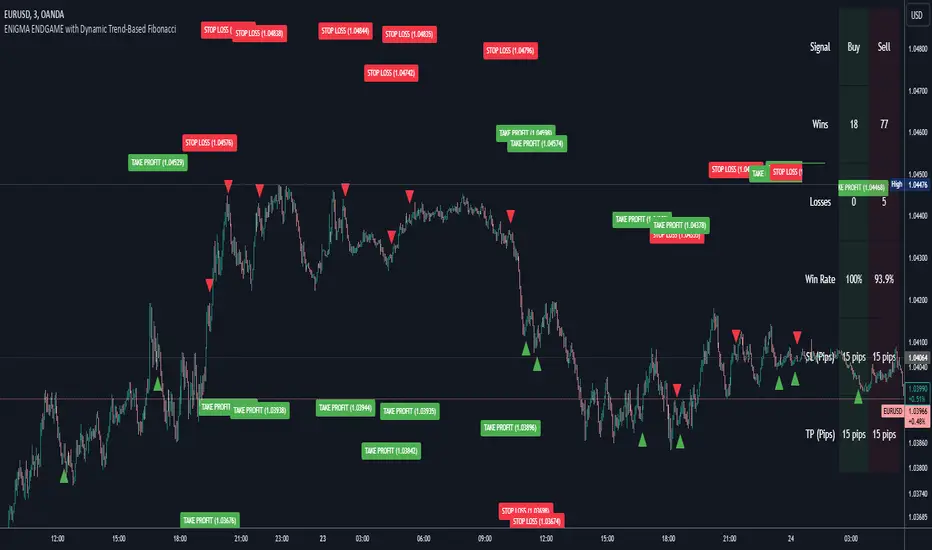
Enigma Endgame with Dynamic Trend-Based FibonacciThe Enigma Endgame script combines dynamic trend-based Fibonacci levels with the core principles of the ENIGMA strategy. It provides traders with actionable signals by identifying key levels of fractal support and resistance and highlighting opportunities to trade with market momentum. This tool is designed for multi-timeframe analysis and is especially effective during high-volatility sessions like London and New York.
Purpose and Usefulness
This script was developed to simplify complex market dynamics by integrating Fibonacci principles with ENIGMA's logic of fractal support and resistance. Traders can use it to:
- Identify key breakout and retracement levels dynamically.
- Understand the shift between support and resistance as price action evolves.
- Gain confidence in their entries with real-time signals derived from logical fractal behavior.
By merging Fibonacci levels with fractal-based trading insights, this script offers a unique and comprehensive approach to analyzing market structure.
How It Works
The script uses a dual approach to provide insights:
1. Dynamic Fibonacci Levels:
- Automatically plots Fibonacci retracement and extension levels based on recent high and low swings, adjusting dynamically to current market trends.
- Allows traders to visualize key levels where price might reverse or extend.
2. Fractal Support and Resistance Logic:
- The script identifies fractal support and resistance by analyzing candle formations.
- When a candle body closes below the low of a previous candle, the previous low, which was fractal support, now becomes fractal resistance. The script generates a bearish signal, encouraging traders to look for sell opportunities at or above the previous low.
- Conversely, when a candle body closes above the high of a previous candle, the previous high, which was fractal resistance, becomes fractal support. The script generates a bullish signal, encouraging traders to look for buy opportunities at or below the previous high.
Real-Time Signals
The script marks these transitions with arrows on the chart:
- Bearish arrows indicate broken fractal support turning into resistance.
- Bullish arrows** indicate broken fractal resistance turning into support.
These signals help traders stay aligned with the trend and trade with market momentum.
Key Features
1. Session-Based Analysis: Focuses on high-probability setups by allowing traders to customize session times, such as London or US sessions.
2. Multi-Timeframe Support: Works seamlessly across multiple timeframes for both scalpers and swing traders.
3. Real-Time Alerts: Sends customizable alerts when price interacts with critical Fibonacci levels or fractal support/resistance shifts.
How to Use the Script
1. Apply the script to a clean chart for clear visualization. Avoid combining it with other scripts unless necessary.
2. Use the arrows to identify shifts in fractal support and resistance and validate opportunities for buy/sell trades.
3. Monitor the dynamic Fibonacci levels to find confluence with key price areas.
4. Customize session times to focus on high-probability trading hours.
Key Notes for Traders
- This script provides insights based on logical market structure but should be used alongside proper risk management and trading plans.
- The fractal-based approach works well in conjunction with dynamic Fibonacci levels, helping traders build confidence in their strategy.
- Adapt the script settings to match your unique trading style and timeframe preferences.
By offering a seamless integration of fractal logic and Fibonacci principles, Enigma Endgame empowers traders with actionable insights to navigate markets effectively.
Support and Resistance TrendlinesStrategy:
Support: Identified as the lowest low over a specific period.
Resistance: Identified as the highest high over a specific period.
Dynamic Trendlines: We’ll use the concept of a rolling window to calculate the highest highs and lowest lows over the last n bars (you can adjust the number of bars for more sensitivity).
Explanation:
Lookback Period (length): The number of bars over which we calculate the support and resistance levels. You can adjust this value depending on the timeframe and the sensitivity you want for the trendlines.
Resistance: This is the highest high over the length of bars. We use ta.highest(high, length) to find the highest high within the specified lookback period.
Support: This is the lowest low over the length of bars. We use ta.lowest(low, length) to find the lowest low within the specified lookback period.
Plotting the Lines:
We plot the support and resistance as horizontal lines on the chart using plot().
Additionally, we create dynamic trendlines that update automatically with each new bar. The line.new function creates lines that can be modified dynamically as new price data comes in.
Line Persistence:
The line functions are used to create horizontal lines that persist across bars. The trendlines adjust their position as the bars move forward.
How It Works:
This indicator will automatically detect the highest and lowest prices over the last n bars and draw support (green line) and resistance (red line) levels on the chart.
The trendlines will adjust as the market evolves and provide visual reference points for potential areas of price reversal.
How to Use This Script:
Copy and paste the Pine Script code into the Pine Script Editor on TradingView.
Save the script, and then add it to your chart.
Adjust the Lookback Period input to suit your trading strategy and timeframe.
The support and resistance levels will be drawn dynamically, and the lines will update as new bars form.
Customizations:
You can modify the number of bars (length) used to calculate support and resistance, depending on the timeframes you're interested in.
If you need more advanced trendline drawing (such as drawing trendlines between significant high/low points or automatic adjustment to more complex patterns), you might need to implement more advanced logic using peaks and valleys or price action patterns.
Let me know if you need any further adjustments!

1-3-1 Strat Combo with 50% Level (12h)Logic Explanation
1-3-1 Combo Detection:
The script detects the 1-3-1 pattern using the previous 3 candles:
Candle 4: Inside Bar (Type 1).
Candle 3: Outside Bar (Type 3).
Candle 2: Inside Bar (Type 1).
4th Candle Behavior:
If the 4th candle (current bar):
Stays an inside bar (Type 1) → isFourthInsideBar is true.
Becomes a directional bar (Type 2) → isFourthDirectional is true.
If either of these conditions is true, the script stops calculating and waits for the next valid 1-3-1 setup.
50% Level Calculation:
If the conditions are not met (e.g., the 4th candle doesn’t stop the pattern), the script:
Plots a dotted line at the 50% level of the 3rd candle.
Adds a label showing the 50% level.
Stop Calculations:
No line, box, or label is drawn if the 4th candle is a Type 1 (inside bar) or Type 2 (directional bar).
Visual Outputs:
Dotted Box: Marks the 1-3-1 combo setup.
50% Line: Drawn only if the 4th candle does not invalidate the pattern.
Label: Displays the 50% level of the 3rd candle.
How to Use:
Apply this script on the 12-hour chart.
The script will:
Detect valid 1-3-1 patterns.
Stop drawing any calculations if the 4th candle is an inside bar (1) or a directional bar (2).
Wait for the next valid 1-3-1 combo.

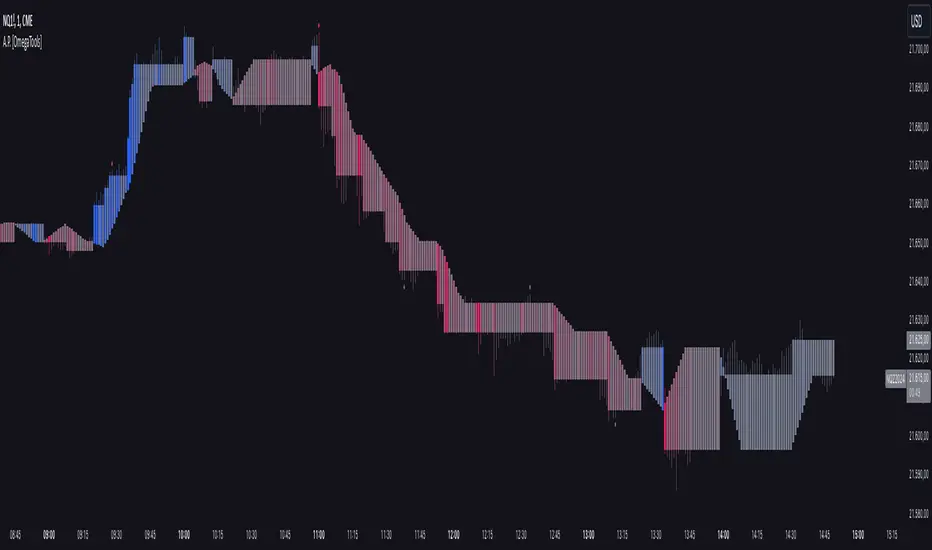
Alternative Price [OmegaTools]The Alternative Price script is a sophisticated and flexible indicator designed to redefine how traders visualize and interpret price data. By offering multiple unique charting modes, robust customization options, and advanced features, this tool provides a comprehensive alternative to traditional price charts. It is particularly useful for identifying market trends, detecting patterns, and simplifying complex data into actionable insights.
This script is highly versatile, allowing users to choose from five distinct charting modes: Candles, Line, Channel, Renko, and Bubbles. Each mode serves a unique purpose and presents price information in an innovative way. When using this script, it is strongly recommended to hide the platform’s default price candles or chart data. Doing so will eliminate redundancy and provide a clearer and more focused view of the alternative price visualization.
The Candles mode offers a traditional candlestick charting style but with added flexibility. Users can choose to enable smoothed opens or smoothed closes, which adjust the way the open and close prices are calculated. When smoothed opens are enabled, the opening price is computed as the average of the actual open price and the closing prices of the previous two bars. This creates a more gradual representation of price transitions, particularly useful in markets prone to sudden spikes or irregularities. Similarly, smoothed closes modify the closing price by averaging it with the previous close, the high-low midpoint, and an exponential moving average of the high-low-close mean. This technique filters out noise, making trends and price momentum easier to identify.
In the Line mode, the script displays a simple line chart that connects the smoothed closing prices. This mode is ideal for traders who prefer minimalism or need to focus on the overall trend without the distraction of individual bar details. The Channel mode builds upon this by plotting additional lines representing the highs and lows of each bar. The resulting visualization resembles a price corridor that helps identify support and resistance zones or price compression areas.
The Renko mode introduces a more advanced and noise-filtering method of visualizing price movements. Renko charts, constructed using the ATR (Average True Range) as a baseline, display blocks that represent a specific price range. The script dynamically calculates the size of these blocks based on ATR, with separate thresholds for upward and downward movements. This makes Renko mode particularly effective for identifying sustained trends while ignoring minor price fluctuations. Additionally, the open and close values of Renko blocks can be smoothed to further refine the visualization.
The Bubbles mode represents price activity using circles or bubbles whose size corresponds to relative volume. This mode provides a quick and intuitive way to assess market participation at different price levels. Larger bubbles indicate higher trading volumes, while smaller bubbles highlight periods of lower activity. This visualization is particularly valuable in understanding the relationship between price movements and market liquidity.
The coloring of candles and other chart elements is a core feature of this script. Users can select between two color modes: Normal and Volume. In Normal mode, bullish candles are displayed in the user-defined bullish color, while bearish candles use the bearish color. Neutral elements, such as midpoints or undecided price movements, are shaded with a neutral color. In Volume mode, the candle colors are dynamically adjusted based on trading volume. A gradient color scale is applied, where the intensity of the bullish or bearish colors reflects the volume for that particular bar. This feature allows traders to visually identify periods of heightened activity and associate them with specific price movements.
Engulfing patterns, a popular technical analysis tool, are automatically detected and marked on the chart when the corresponding setting is enabled. The script identifies long engulfing patterns, where the current bar's range completely encompasses the previous bar’s range and indicates a potential bullish reversal. Similarly, short engulfing patterns are identified where the current bar fully engulfs the previous bar in the opposite direction, suggesting a bearish reversal. These patterns are visually highlighted with circular markers to draw the trader’s attention.
Each feature and mode is highly customizable. The colors for bullish, bearish, and neutral movements can be personalized, and the thresholds for patterns or smoothing can be fine-tuned to match specific trading strategies. The script's ability to toggle between various modes makes it adaptable to different market conditions and analysis preferences.
In summary, the Alternative Price script is a comprehensive tool that redefines the way traders view price charts. By offering multiple visualization modes, customizable features, and advanced detection algorithms, it provides a powerful way to uncover market trends, volume relationships, and significant patterns. The recommendation to hide default chart elements ensures that the focus remains on this innovative tool, enhancing its usability and clarity. This script empowers traders to gain deeper insights into market behavior and make informed trading decisions, all while maintaining a clean and visually appealing chart layout.
Keep in mind that some of the modes of this indicator might not reflect the actual closing price of the underlying asset, before opening a trade, check carefully the actual price!
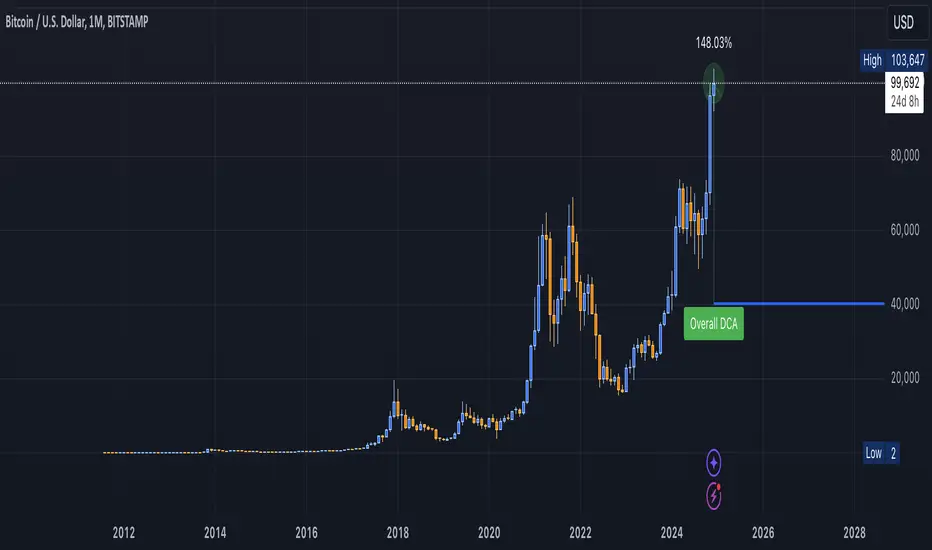
DCA Valuation & Unrealized GainsThis Pine Script for TradingView calculates and visualizes the relationship between a Dollar Cost Average (DCA) price and the All-Time High (ATH) price for over 50 different cryptocurrencies. Here's what it does:
1. Inputs for DCA Prices:
- Users can manually input DCA prices for specific cryptocurrencies (e.g., BTC, ETH, BNB).
2. Dynamic ATH Calculation:
- Dynamically calculates the ATH price for the current asset using the highest price in the chart's loaded data and persists this value across bars.
3. Percentage Change from DCA to ATH:
- Computes the percentage gain from the DCA price to the ATH price.
4. Visualizations:
- Draws a line at the DCA price and the ATH price, both extended to the right.
- Adds an arrow pointing from the DCA price to the ATH, offset by 10 bars into the future.
- Displays labels for:
- The percentage gain from DCA to ATH.
- "No DCA Configured" if no valid DCA price is set for the asset.
5. Color Coding:
- Labels and arrows are color-coded to indicate positive or negative percentage changes:
- Green for gains.
- Red for losses.
6. Adaptability:
- The script dynamically adjusts to the current asset based on its ticker and uses the corresponding DCA price.
This functionality provides traders with clear insights into their investment's performance relative to its ATH, aiding in decision-making.
-----
To add a new asset to the script:
1. Define the DCA Input: Add a new input for the asset's DCA price using the `input.float` function. For example:
dcaPriceNEW = input.float(title="NEW DCA Price", defval=0.1, tooltip="Set the DCA price for NEW")
2. Add the Asset Logic: Include a conditional check for the new asset in the ticker matching logic:
if str.contains(currentAsset, "NEW") and dcaPriceNEW != 0
dcaPrice := dcaPriceNEW
Where NEW is the ticker symbol of the asset you're adding.
NOTE: SOLO had to be put before SOL because otherwise the indicator was pulling the DCA price from SOL even on the SOLO chart. If you have a similar issue, try that fix.
Adding an asset requires only these two changes. Once done, the script dynamically incorporates the new asset into its calculations and visualizations.
Customizable Multi-Timeframe Doji with Ray and Editable LabelScript Overview
Script Name: Customizable Multi-Timeframe Doji Candle Levels with Ray and Editable Label
Purpose: This script helps traders identify significant price levels based on high timeframe Doji candles, allowing them to visualize key areas of support, resistance, entry, and exit. By plotting real-time Doji levels from higher timeframes directly on the current chart, traders can easily spot areas where market indecision or potential trend reversals have previously occurred, making these levels highly relevant for future price action.
How the Script Works
This script detects Doji candles on a selected higher timeframe (e.g., daily, weekly, monthly) and plots a ray at the Doji’s closing level on the current chart. The Doji candle formation, characterized by an open and close that are very close or equal, is often an indicator of market indecision. By identifying these Doji levels from high timeframes, the script provides traders with insight into where strong support and resistance zones may form.
The script continuously monitors and updates the Doji level based on the selected timeframe, ensuring that only the latest detected Doji candle is displayed on the chart, helping traders avoid clutter and focus on the most recent data.
Core Components and Calculations
1 Doji Detection Logic:
-The script calculates the Doji candle formation based on a small body percentage (defined by the C_DojiBodyPercent parameter) and relative symmetry in upper and lower shadows (defined by C_ShadowPercent and C_ShadowEqualsPercent).
-A Doji is considered valid when the open and close prices are nearly equal, and the shadows are symmetric within the defined parameters, indicating indecision.
2 Multi-Timeframe Data Retrieval:
-Using the request.security() function, the script fetches open, high, low, and close prices from the specified higher timeframe. It applies Doji detection logic to this higher timeframe data.
-barmerge.lookahead_on and barmerge.gaps_on ensure real-time updates, so the Doji level is immediately reflected on the chart when detected.
3 Ray and Label Plotting:
-When a Doji candle is detected on the selected timeframe, the script plots a ray at the Doji's close price, extending forward on the chart.
-Customizable options for the ray, including color, width, and style (solid, dotted, or dashed), help traders visually differentiate the Doji levels from other chart elements.
-An editable label can be positioned alongside the ray to denote the Doji level, with customizable text, color, background, and size to provide additional context.
4 Automatic Line and Label Management:
-The script dynamically deletes any previous ray and label when a new Doji is detected. This approach minimizes chart clutter and ensures that only the most recent Doji level from the higher timeframe is displayed.
Customization Options
1 Timeframe Selection:
Users can choose any timeframe (e.g., hourly, daily, weekly, monthly) to display Doji levels based on their specific trading strategy.
2 Ray and Label Appearance:
Ray: Customize color, width, and line style (solid, dotted, dashed) for better visibility and integration with the chart’s theme.
Label: Customize the label text, background color, text color, text size, and position (above, below, left, or right of the ray) for a personalized view.
How to Use This Script
1 Select the Target Timeframe for Doji Detection: Choose a high timeframe (such as daily or weekly) to view Doji-based support/resistance levels.
2 Set Custom Ray and Label Parameters : Adjust the visual aspects of the ray and label to align with your chart setup and make the Doji level stand out.
3 Interpretation of Doji Levels: Use the plotted Doji levels as potential support or resistance zones. Since Doji candles reflect market indecision, they often precede significant price reversals or strong continuation moves. By analyzing these levels, traders can:
- Identify key support/resistance zones based on historical market indecision.
- Set entry and exit levels around these zones to capitalize on potential reversals or
continuations.
-Spot confluence areas where the Doji level aligns with other indicators or technical patterns.
Recommended Chart Setup
For optimal clarity, use this script on a clean chart, free from overlapping indicators. This script is designed to work independently, so avoid layering multiple support/resistance scripts unless essential to avoid clutter. A clean chart helps ensure that Doji levels are readily visible, enabling a clear focus on significant levels relevant to your trading strategy.

Uphorico Candle RangesThis script allows you to see the high and low prices of a specific previous timeframe directly on your TradingView chart. You can choose which previous period to view—previous month, week, day, or last Monday—and the script will plot two horizontal lines for the high and low prices of that period. These lines help you quickly identify key levels based on past performance.
Features of the Script:
1. Select Previous Timeframe: You can choose between:
• Month: Shows the high and low of the previous month.
• Week: Shows the high and low of the previous week.
• Day: Shows the high and low of the previous day.
• Monday: Shows the high and low of the most recent Monday.
2. Line Customization:
• Color: Choose different colors for the high and low lines.
• Thickness: Adjust the line thickness (1–5).
• Style: Choose from solid, dashed, or dotted lines.
3. Touch Source Candle Option:
• If enabled, the lines will start directly at the last candle of the selected timeframe (e.g., at the last candle of the previous month or week).
• If disabled, the lines will start from the current bar and extend to the right.
How It Works:
• The script retrieves the high and low prices from your selected previous timeframe and draws two horizontal lines (one for the high and one for the low).
• These lines provide a quick visual reference for key support and resistance levels based on past periods, making it easier to spot potential price action zones.
This tool is designed to be simple and customizable, helping you analyze past levels and make better trading decisions.

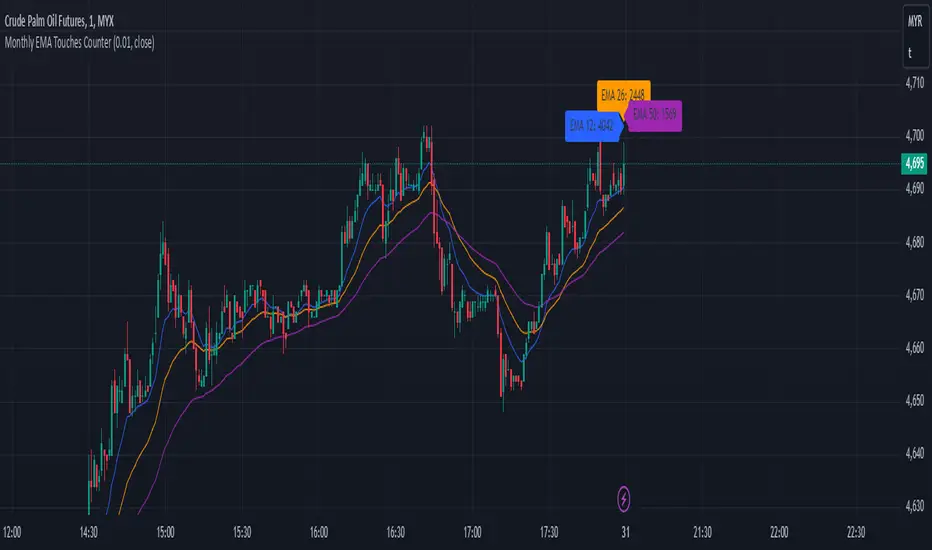
Monthly EMA Touches CounterKey Features of This Script:
Touch Threshold: The script checks if the price is within a specified percentage of each EMA.
Monthly Touch Counters: Separate counters (touchCountEMA12, touchCountEMA26, touchCountEMA50) are used to count touches for each EMA.
Reset Logic: All counters reset at the start of a new month using if ta.change(time("M")).
Increment Logic: Each counter increments whenever the corresponding EMA is touched during a bar.
Label Management: Labels are created to display each count above the bars at the end of each month.
Alert Conditions: Alerts are set up for when the price touches any of the EMAs.
Usage:
Copy and paste this script into TradingView's Pine Script editor.
Add it to your chart to see how many times the price has touched each of the EMAs (12, 26, and 50) on a monthly basis.
Adjust the Touch Threshold (%) input as needed for sensitivity.
This implementation will allow you to effectively track and visualize how often price touches each of these EMAs on a monthly basis. If you have further modifications or additional features you'd like to explore, feel free to ask
Distance between EMA 50-100/100-150This script calculates and plots the percentage difference between the 50-period, 100-period, and 150-period Exponential Moving Averages (EMA) on a TradingView chart. The aim is to provide a clear visual representation of the market's momentum by analyzing the distance between key EMAs over time.
Key features of this script:
1. EMA Calculation : The script computes the EMA values for 50, 100, and 150 periods and calculates the percentage difference between EMA 50 and 100, and between EMA 100 and 150.
2. Custom Threshold : Users can adjust a threshold percentage to highlight significant divergences between the EMAs. A default threshold is set to 0.1%.
3. Visual Alerts : When the percentage difference exceeds the threshold, a visual marker appears on the chart:
Green Circles for bullish momentum (positive divergence),
Red Circles for bearish momentum (negative divergence),
Diamonds to indicate the first occurrence of new bullish or bearish signals, allowing users to catch fresh market trends.
4. Dynamic Plotting : The script plots two lines representing the percentage difference for each EMA pair, offering a quick and intuitive way to monitor trends.
Ideal for traders looking to gauge market direction using the relationship between multiple EMAs, this script simplifies analysis by focusing on key moving average interactions.

Multiple SMA, EMA, and VWAP CrossoversMultiple SMA, EMA, and VWAP Crossovers with Alerts
Overview : The "Multiple SMA, EMA, and VWAP Crossovers" script is designed for traders who want to monitor various simple moving averages (SMAs), exponential moving averages (EMAs), and the volume-weighted average price (VWAP) to identify potential buy and sell opportunities. This script allows you to visualize key moving averages on your chart and create custom alerts for specific crossover events.
Detail s: This script plots the following moving averages:
Simple Moving Averages (SMA): 5, 10, 20, 50, 100, 200, and 325 periods
Exponential Moving Average (EMA): 9 periods
Volume-Weighted Average Price (VWAP)
It includes options to display these moving averages and set alerts for their crossovers.
Available Crossovers:
20/50 SMA, 20/100 SMA, 20/200 SMA, 20/325 SMA
50/100 SMA, 50/200 SMA, 50/325 SMA
100/200 SMA, 100/325 SMA
200/325 SMA
VWAP/20 SMA, VWAP/50 SMA, VWAP/100 SMA, VWAP/200 SMA, VWAP/325 SMA
Optional Lines to Add to the Chart:
9 EMA, 5 SMA, 10 SMA, 20 SMA, 50 SMA, 100 SMA, 200 SMA, 325 SMA, VWAP
How to Use:
Enable Indicators: Use the input options to select which SMAs, EMA, and VWAP you want to display on your chart.
Set Alerts: Choose the specific crossover events you want to monitor. For example, you can set an alert for the 20/50 SMA crossover or the VWAP/100 SMA crossover.
Monitor the Chart: The script will plot the selected moving averages on your chart. When a selected crossover event occurs, an alert will be triggered, notifying you of the potential trade opportunity.
Usage Tips:
Trending Market: Use the buy and sell alerts in trending markets where the moving averages can help confirm the direction of the trend.
Key Support and Resistance Levels: Combine crossover alerts with key support and resistance levels for more reliable trading signals.
Volume Confirmation: Ensure there is sufficient volume to support the crossover signals, indicating stronger momentum behind the move.
When NOT to Use Buy and Sell Alerts:
Low Volume: Avoid using buy and sell alerts during periods of low trading volume, as the signals may be less reliable.
Market Noise: Be cautious in highly volatile markets where frequent crossovers might generate false signals.
Sideways Market: In a sideways or range-bound market, crossover signals can result in multiple whipsaws, leading to potential losses.
Why Use This Script? This script provides a comprehensive tool for traders to monitor multiple moving averages and VWAP crossovers efficiently. It allows you to customize alerts based on your trading strategy and helps you make informed decisions by visualizing key technical indicators on your chart.
Legal Disclaimer: The information provided by this script is for educational and informational purposes only and should not be considered financial advice. The developer of this script is not responsible for any financial losses incurred from using this script.

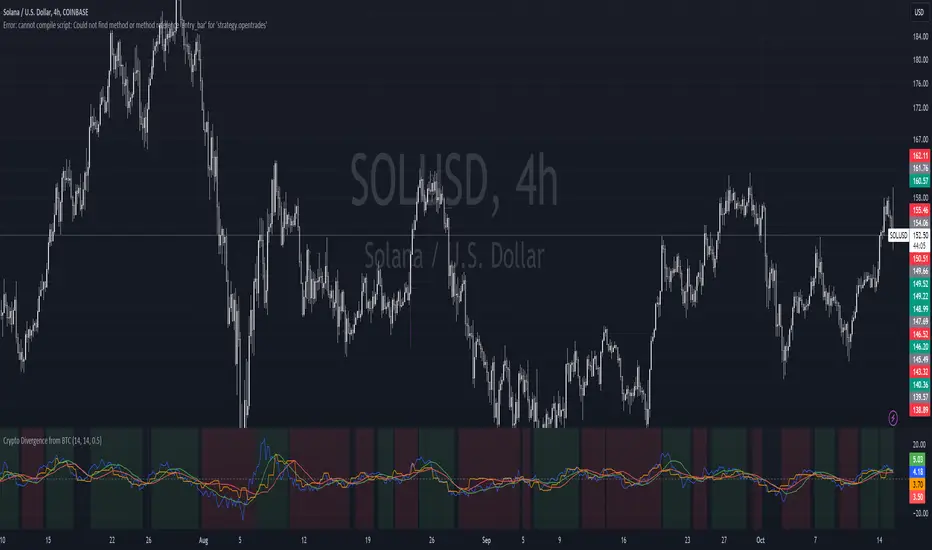
Crypto Divergence from BTCThis script is used to indicate when price action of a crypto coin is diverging significantly from that of BTC.
Explanation of the Script:
Inputs:
roc_length: The period used for calculating the Rate of Change.
ma_length: The period used for the moving average of the ROC.
threshold: The percentage difference that indicates a divergence.
Price Data:
The script retrieves the current asset's price and Bitcoin's price.
ROC Calculation:
The ROC for both the current asset and BTC is calculated based on the defined roc_length.
Moving Averages:
Simple moving averages (SMA) of the ROC values are calculated to smooth out the data.
Divergence Detection:
The indicator checks if the current asset's ROC MA is significantly higher or lower than Bitcoin's ROC MA based on the specified threshold.
Plotting:
The script plots the ROC values and their moving averages.
It also highlights the background in green when a bullish divergence is detected (when the asset is moving up while BTC is lagging) and in red for a bearish divergence.
Stochastics Confluences 4 in 1Description of the Pine Script:
This script plots the Full Stochastic indicator for four different time periods, and highlights conditions where potential buy or sell signals can be identified. The Stochastic indicator measures the position of the current closing price relative to the range of high and low prices over a defined period, helping traders identify overbought and oversold conditions.
Key Features:
Stochastic Calculation for 4 Different Periods:
The script calculates the Stochastic for four separate lookback periods: 9, 14, 40, and 60 bars.
Each Stochastic value is smoothed by a Simple Moving Average (SMA) to reduce noise and provide a clearer signal.
Visual Representation:
It plots each Stochastic value on the chart using different colors, allowing the user to see how the different periods of the indicator behave relative to each other.
Horizontal lines are drawn at 80 (Upper Bound) and 20 (Lower Bound), commonly used to identify overbought and oversold regions.
Highlighting Buy and Sell Conditions:
Green Highlight (Potential Buy Signal):
When all four Stochastic values (for the four different periods) are below 20, this suggests that the asset is in an oversold condition across multiple timeframes. The green background highlight appears when the Stochastic lines converge below 20, indicating a potential buy signal, as the price may be preparing to move upward from an oversold state.
Red Highlight (Potential Sell Signal):
When all four Stochastic values are above 80, the asset is in an overbought condition across multiple timeframes. The red background highlight appears when the Stochastic lines converge above 80, indicating a potential sell signal, as the price may soon reverse downward from an overbought state.
How to Interpret the Signals:
Buy Signals (Green Highlight):
When the chart is highlighted in green, it means the Stochastic indicators for all four periods are below 20, signaling that the asset is oversold and may be nearing a potential upward reversal. This condition suggests a possible buying opportunity, especially when other indicators confirm the potential for an upward trend.
Sell Signals (Red Highlight):
When the chart is highlighted in red, it indicates that the Stochastic indicators for all four periods are above 80, meaning the asset is overbought. This condition signals a possible downward reversal, suggesting a potential selling opportunity if the price begins to show signs of weakness.
By using this script, traders can visually identify periods of strong confluence across different timeframes when the Stochastic indicators are in extreme oversold or overbought conditions, which are traditionally seen as strong buy or sell signals.
This approach helps filter out weaker signals and focuses on moments when all timeframes align, increasing the probability of a successful trade.

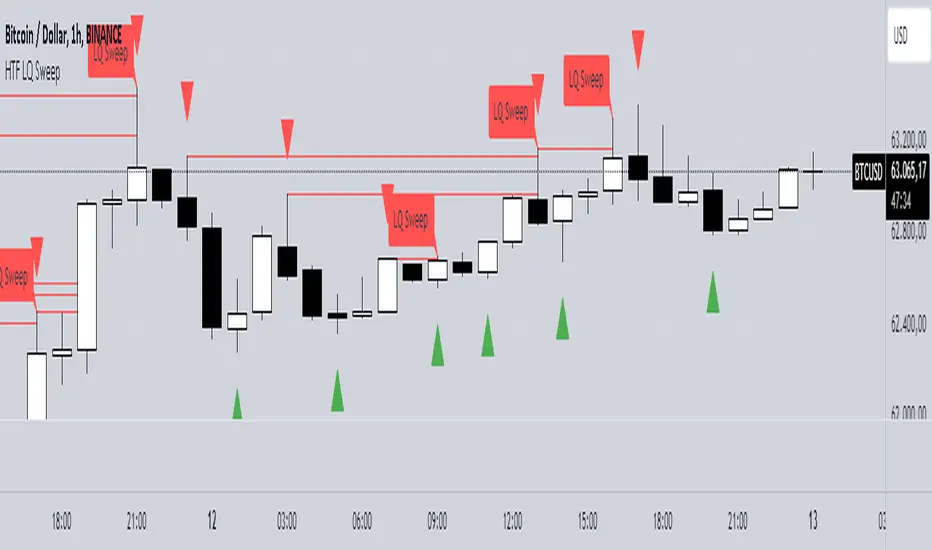
HTF LQ SweepThe following script recognises QL sweeps in the desired time frame with alarm function!
Theory:
There is liquidity above highs and below lows. If this is tapped and the market reacts strongly immediately, the probability of a reversal is greatly increased! In the chart, this is defined in such a way that a candle has its wicks BELOW the old low, but the close is ABOVE the old low. the same applies to the high, of course!
In such a case we have an "LQ Sweep"
How does the script work?
Williams 3 fractals are used as a basis. These are meaningful as lows or highs. Whenever a fractal is created, the price level is saved.
This means that not only the last fractal is relevant, but all historical fractals as long as they have not been reached!
If a candle reaches the level, but shows a rejection and closes within the level again, we have our "LQ Sweep" setup.
In the script you can select the timeframe in which the market has to be analysed. When the QL sweep occurs, an alert is triggered. This saves a lot of time because you can analyse different markets in different timeframes at the same time!
Each QL Sweep is marked in the chart when we are in the selected timeframe. These can also be deactivated so that only the last sweep is displayed.
Benefits for the trader:
An LQ sweep is a nice confirmation for a reversal.
If we have such an LQ sweep, we can wait in the lower timeframe for further confirmation, such as a structural break, to position our entries there.
The alarm function saves us a lot of time and we only go to the chart when a potential setup has been created.
You can set different time frames in the script: The selected time frame is then scanned and sends a signal when the event occurs.
---Advanced Harmonic Pattern Scanner v5Summary of the Script:
All Patterns Covered: The script includes all major harmonic patterns: Butterfly, Gartley, Crab, Bat, Cypher, and Three Drives. Both bullish and bearish versions are detected.
ZigZag Swings: The zigzag logic helps find swing points (X, A, B, C, D) which are essential for forming these patterns. You can adjust the zigzagDepth parameter to fine-tune how sensitive the pattern detection is to price swings.
Fibonacci Levels: Each pattern uses specific Fibonacci retracement or extension levels to identify potential patterns, and the script compares price movements to these ratios.
Visual Aid: It uses plotshape() to display detected patterns on the chart and optional line.new() functions to connect the swing points for a better visual representation of the patterns.
How to Customize:
Timeframe: You can run this script on different timeframes by changing the chart on TradingView (1 min, 1 hour, 1 day, etc.).
ZigZag Sensitivity: Adjust the zigzagDepth to refine how frequently swing points are detected. Larger numbers will reduce sensitivity and show fewer but more pronounced patterns.
Pattern Refinement: Modify Fibonacci levels to experiment with custom harmonic patterns or adjust thresholds for the existing ones.
This code is an advanced version and scans the market comprehensively for all major harmonic patterns. Let me know if you need further modifications or explanations!

HTFBands█ OVERVIEW
Contains type and methods for drawing higher-timeframe bands of several types:
Bollinger bands
Parabolic SAR
Supertrend
VWAP
By copy pasting ready made code sections to your script you can add as many multi-timeframe bands as necessary.
█ HOW TO USE
Please see instructions in the code. (Important: first fold all sections of the script: press Cmd + K then Cmd + - (for Windows Ctrl + K then Ctrl + -)
█ FULL LIST OF FUNCTIONS AND PARAMETERS
atr2(length)
An alternate ATR function to the `ta.atr()` built-in, which allows a "series float"
`length` argument.
Parameters:
length (float) : (series int/float) Length for the smoothing parameter calculation.
Returns: (float) The ATR value.
pine_supertrend2(factor, atrLength, wicks)
An alternate SuperTrend function to `supertrend()`, which allows a "series float"
`atrLength` argument.
Parameters:
factor (float) : (series int/float) Multiplier for the ATR value.
atrLength (float) : (series int/float) Length for the ATR smoothing parameter calculation.
wicks (simple bool) : (simple bool) Condition to determine whether to take candle wicks into account when
reversing trend, or to use the close price. Optional. Default is false.
Returns: ( ) A tuple of the superTrend value and trend direction.
method getDefaultBandQ1(bandType)
For a given BandType returns its default Q1
Namespace types: series BandTypes
Parameters:
bandType (series BandTypes)
method getDefaultBandQ2(bandType)
For a given BandType returns its default Q2
Namespace types: series BandTypes
Parameters:
bandType (series BandTypes)
method getDefaultBandQ3(bandType)
For a given BandType returns its default Q3
Namespace types: series BandTypes
Parameters:
bandType (series BandTypes)
method init(this, bandsType, q1, q2, q3, vwapAnchor)
Initiates RsParamsBands for each band (used in htfUpdate() withi req.sec())
Namespace types: RsParamsBands
Parameters:
this (RsParamsBands)
bandsType (series BandTypes)
q1 (float) : (float) Depending on type: BB - length, SAR - AF start, ST - ATR's prd
q2 (float) : (float) Depending on type: BB - StdDev mult, SAR - AF step, ST - mult
q3 (float) : (float) Depending on type: BB - not used, SAR - AF max, ST - not used
vwapAnchor (series VwapAnchors) : (VwapAnchors) VWAP ahcnor
method init(this, bandsType, tf, showRecentBars, lblsShow, lblsMaxLabels, lblSize, lnMidClr, lnUpClr, lnLoClr, fill, fillClr, lnWidth, lnSmoothen)
Initialises object with params (incl. input). Creates arrays if any.
Namespace types: HtfBands
Parameters:
this (HtfBands)
bandsType (series BandTypes) : (BandTypes) Just used to enable/disable - if BandTypes.none then disable )
tf (string) : (string) Timeframe
showRecentBars (int) : (int) Only show over this number of recent bars
lblsShow (bool) : (bool) Show labels
lblsMaxLabels (int) : (int) Max labels to show
lblSize (string) : (string) Size of the labels
lnMidClr (color) : (color) Middle band color
lnUpClr (color) : (color) Upper band color
lnLoClr (color) : (color) Lower band color
fill (bool)
fillClr (color) : (color) Fill color
lnWidth (int) : (int) Line width
lnSmoothen (bool) : (bool) Smoothen the bands
method htfUpdateTuple(rsPrms, repaint)
(HTF) Calculates Bands within request.security(). Returns tuple . If any or all of the bands are not available returns na as their value.
Namespace types: RsParamsBands
Parameters:
rsPrms (RsParamsBands) : (RsParamsBands) Parameters of the band.
repaint (bool) : (bool) If true does not update on realtime bars.
Returns: A tuple (corresponds to fields in RsReturnBands)
method importRsRetTuple(this, htfBi, mid, up, lo, dir)
Imports a tuple returned from req.sec() into an HtfBands object
Namespace types: HtfBands
Parameters:
this (HtfBands) : (HtfBands) Object to import to
htfBi (int) : (float) Higher timeframe's bar index (Default = na)
mid (float)
up (float) : (float) Value of upper band (Default = na)
lo (float) : (float) Value of lower band (Default = na)
dir (int) : (int) Direction (for bands like Parabolic SAR) (Default = na)
method addUpdDrawings(this, rsPrms)
Draws band's labels
Namespace types: HtfBands
Parameters:
this (HtfBands)
rsPrms (RsParamsBands)
method update(this)
Sets band's values to na on intrabars if `smoothen` is set.
Namespace types: HtfBands
Parameters:
this (HtfBands)
method newRsParamsBands(this)
A wraper for RsParamsBands.new()
Namespace types: LO_A
Parameters:
this (LO_A)
method newHtfBands(this)
A wraper for HtfBands.new()
Namespace types: LO_B
Parameters:
this (LO_B)
RsParamsBands
Used to pass bands' params to req.sec()
Fields:
bandsType (series BandTypes) : (enum BandTypes) Type of the band (BB, SAR etc.)
q1 (series float) : (float) Depending on type: BB - length, SAR - AF start, ST - ATR's prd
q2 (series float) : (float) Depending on type: BB - StdDev mult, SAR - AF step, ST - mult
q3 (series float) : (float) Depending on type: BB - not used, SAR - AF max, ST - not used
vwapAnchor (series VwapAnchors)
RsReturnBands
Used to return bands' data from req.sec(). Params of the bands are in RsParamsBands
Fields:
htfBi (series float) : (float) Higher timeframe's bar index (Default = na)
upBand (series float) : (float) Value of upper band (Default = na)
loBand (series float) : (float) Value of lower band (Default = na)
midBand (series float) : (float) Value of middle band (Default = na)
dir (series int) : (float) Direction (for bands like Parabolic SAR) (Default = na)
BandsDrawing
Contains plot visualization parameters and stores and keeps track of lines, labels and other visual objects (not plots)
Fields:
lnMidClr (series color) : (color) Middle band color
lnLoClr (series color) : (color) Lower band color
lnUpClr (series color) : (color) Upper band color
fillUpClr (series color)
fillLoClr (series color)
lnWidth (series int) : (int) Line width
lnSmoothen (series bool) : (bool) Smoothen the bands
showHistory (series bool) : (bool) If true show bands lines, otherwise only current level
showRecentBars (series int) : (int) Only show over this number of recent bars
arLbl (array) : (label Labels
lblsMaxLabels (series int) : (int) Max labels to show
lblsShow (series bool) : (bool) Show labels
lblSize (series string) : (string) Size of the labels
HtfBands
Calcs and draws HTF bands
Fields:
rsRet (RsReturnBands) : (RsReturnBands) Bands' values
rsRetNaObj (RsReturnBands) : (RsReturnBands) Dummy na obj for returning from request.security()
rsPrms (RsParamsBands) : (RsParamsBands) Band parameters (for htfUpdate() called in req.sec() )
drw (BandsDrawing) : (BandsDrawing) Contains plot visualization parameters and stores and keeps track of lines, labels and other visual objects (not plots)
enabled (series bool) : (bool) Toggles bands on/off
tf (series string) : (string) Timeframe
LO_A
LO Library object, whose only purpose is to serve as a shorthand for library name in script code.
Fields:
dummy (series string)
LO_B
LO Library object, whose only purpose is to serve as a shorthand for library name in script code.
Fields:
dummy (series string)

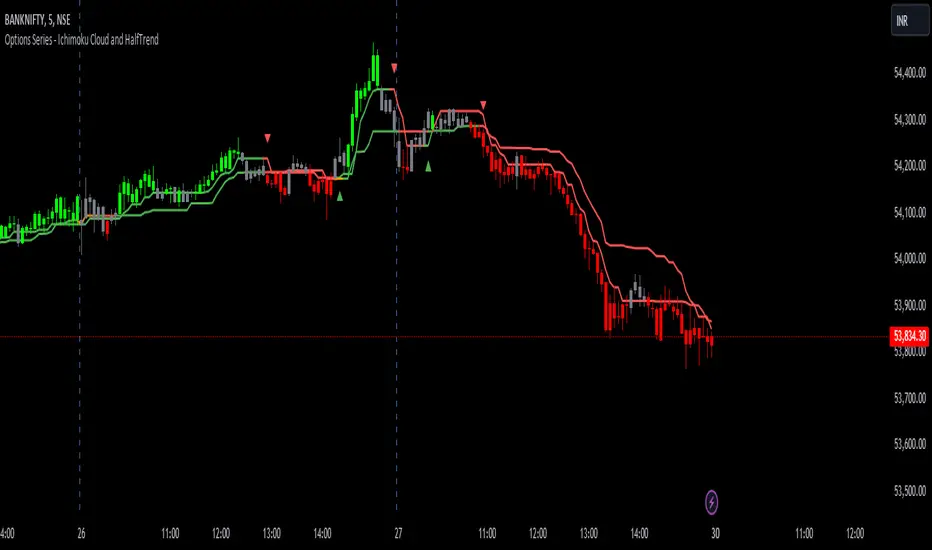
Options Series - Ichimoku Cloud and HalfTrend
The provided script combines two powerful technical indicators, Ichimoku Cloud and HalfTrend, to create a hybrid trading tool. Here's an analysis of the key components and how they work together:
Ichimoku Cloud and HalfTrend
⭐ 1. Indicator Title and Settings:
The script sets the title as "Options Series - Ichimoku Cloud and HalfTrend" and uses the overlay=true option to display the indicators directly on the price chart.
⭐ 2. Color Definitions:
Several colors are defined for later use:
Green and Red for different types of candles and signals.
Fluorescent Colors for highlighting significant trends or changes in market conditions.
⭐ 3. Ichimoku Cloud Setup:
The Ichimoku Cloud is a comprehensive indicator used to identify support, resistance, and trend direction. Here’s how the script configures it:
Conversion Periods, Base Periods, Lagging Span 2 Periods, and Displacement are customizable via input options, giving flexibility to adjust Ichimoku settings based on different market conditions.
The function donchian(len) calculates the Donchian Channel average, which is used to define the Conversion Line and Base Line. The crossover of these lines is crucial in determining bullish or bearish trends.
Color Logic for Kijun Cross: If the Conversion Line is above the Base Line, the trend is bullish (green color), while a bearish trend is indicated by red. A neutral condition is marked with orange.
⭐ 4. HalfTrend Indicator Setup:
The HalfTrend indicator detects trend reversals based on high/low price deviations from a moving average:
Amplitude and Channel Deviation inputs allow users to control the sensitivity of the indicator.
showArrows and showChannels toggle the display of buy/sell arrows and trend channels.
maxLowPrice and minHighPrice variables are initialized to track significant high/low points during the trend, used to confirm trend reversals.
⭐ 5. ATR and Trend Calculations:
The Average True Range (ATR) is used to calculate the volatility-based channels. The script calculates atr2 and uses this to create atrHigh and atrLow for plotting the channel.
The trend detection logic is as follows:
When the trend is upward, the script seeks confirmation by comparing the high moving average with previous lows, signaling a continuation of the uptrend if it holds.
Conversely, a downtrend is confirmed when the low moving average exceeds previous highs.
⭐ 6. Customized Candle Coloring:
A custom color scheme is applied to candles based on a combination of trend direction and Ichimoku Cloud signals:
GreenFluorescent for strong bullish conditions where price is above the HalfTrend line, and the Conversion Line is above the Base Line.
RedFluorescent for strong bearish conditions, with price below the HalfTrend line and Conversion Line below the Base Line.
Gray for neutral or indecisive conditions.
⭐ 7. Plots and Shapes:
The script plots various elements:
HalfTrend Line: The main trendline is plotted in either green (buy) or red (sell), with adjustable line width.
Ichimoku Base Line: This is plotted with the dynamic color based on crossovers.
Buy/Sell Arrows: These are drawn on the chart when valid buy/sell conditions are met.
Custom Candles: The script overrides default chart candles with custom-colored candles based on the previously discussed logic.
⭐ 8. Improvements:
Optimization: Parameters like the amplitude, channel deviation, and Ichimoku periods can be fine-tuned based on backtesting results to maximize performance for specific assets or timeframes.
Alerts: The script could be enhanced by adding alert conditions for real-time buy/sell notifications, leveraging alertcondition() in Pine Script.
In summary, this script merges two trend-following techniques for a multi-faceted view of the market, using visual cues and trendline logic to provide a robust trading tool.
🚀 Conclusion:
Trend-Following System: The combination of Ichimoku Cloud and HalfTrend provides a comprehensive view of both long-term trends (via Ichimoku) and shorter-term reversals (via HalfTrend).
Visual Signals: The script includes clear visual signals (arrows and custom-colored candles) to help traders quickly spot buy/sell opportunities.
Dynamic Customization: Through user inputs, this indicator can be tailored to different market conditions, making it versatile.
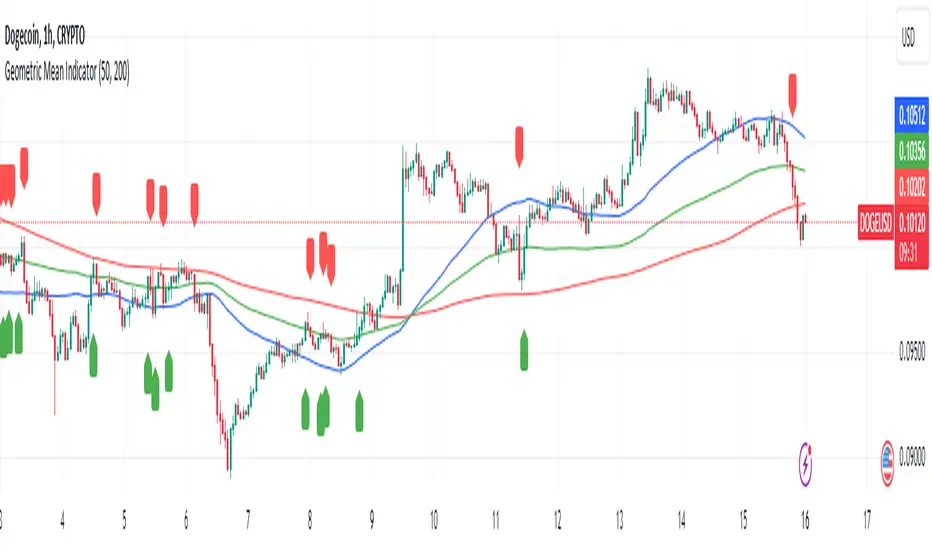
Geometric Mean IndicatorThis script calculates and plots the Geometric Mean (GM) of two significant price levels (in this case, moving averages) to identify balance points or equilibrium levels in the market.
Key Components of the Script:
Input Variables:
length1: Defines the period for the first moving average (representing the first radius 𝑥x).
length2: Defines the period for the second moving average (representing the second radius
𝑦y).
Moving Averages (Price Levels):
ma1: The first moving average (calculated using the closing price over the period defined by length1).
ma2: The second moving average (calculated using the closing price over the period defined by length2).
Geometric Mean (GM) Calculation:
The geometric mean between the two moving averages is calculated as:
GM = sqrt(ma1 * ma2)
This value represents the midpoint or balance between the two price levels (analogous to the geometric mean between the radii in the mathematical discovery).
Plotting the Values:
The script plots:
ma1: First moving average (blue line).
ma2: Second moving average (red line).
geometric_mean: The geometric mean of the two moving averages (green line), which serves as the dynamic equilibrium point.
Visual Markers for Crossovers:
The script detects when the price crosses above or below the geometric mean:
Green markers (below the bar) indicate a crossover above the geometric mean.
Red markers (above the bar) indicate a crossover below the geometric mean.
Purpose of the Indicator:
The Geometric Mean Indicator is designed to:
Highlight equilibrium points: The geometric mean between two price levels can signal areas where the market is balanced or poised for a potential breakout.
Detect potential trend reversals: When the price crosses above or below the geometric mean, it can indicate shifts in market momentum, similar to how the GM in geometry represents a transition point.
How to Use:
Dynamic Equilibrium: The geometric mean (green line) represents a balance between two price levels (moving averages) and can act as support or resistance.
Price Crossovers: Watch for price crossing the geometric mean to identify potential trend changes or areas of significant price action.
Adjust Inputs: You can modify the lengths of the moving averages (length1 and length2) to adjust the sensitivity of the indicator based on different timeframes or strategies.
Summary in Context of the Geometric Proof:
The script applies the geometric concept of the Geometric Mean (GM) as a balance point between two radii (represented by moving averages in this case).
It mirrors the idea that the GM is the midpoint of the tangent slope between two circles, where the moving averages (or price levels) serve as the "radii" in the market context.
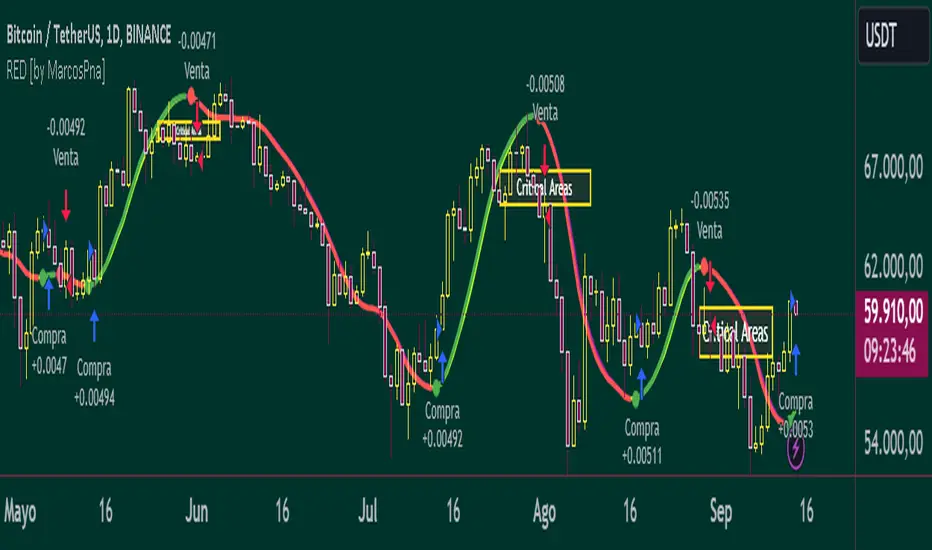
Reflected ema Difference (RED) This script, titled "Reflected EMA Difference (RED)," is based on the logic of evaluating the percentage of convergence and divergence between two moving averages, specifically the Hull Moving Averages (HMA), to make price-related decisions. The Hull Moving Average, created by Alan Hull, is used as the foundation of this strategy, offering a faster and more accurate way to analyze market trends. In this script, the concept is employed to measure and reflect price variations.
Script Functionality Overview:
Hull Moving Averages (HMA): The script utilizes two HMAs, one short-term and one long-term. The main idea is to compute the Delta Difference between these two moving averages, which represents how much they are converging or diverging from each other. This difference is key to identifying potential market trend changes.
Reflected HMA Value: Using the Delta Difference between the HMAs, the value of the short-term HMA is reflected, creating a visual reference point that helps traders see the relationship between price and HMAs on the chart.
Percentage Change Index: The second key parameter is the percentage change index. This determines when a trend is reversing, allowing buy or sell orders to be established based on significant changes in the relationship between the HMAs and the price.
Delta Multiplier: The script comes with a default Delta multiplier of 2 for calculating the difference between HMAs, allowing traders to adjust the sensitivity of the analysis based on the time frame being analyzed.
Trend Reversal Signals: When the price crosses the thresholds defined by the percentage change index, buy or sell signals are triggered, based on the detection of a potential trend reversal.
Visual Cues with Boxes: Boxes are drawn on the chart when the HullMA crosses the reflected HMA value, providing a visual aid to identify critical moments where risk should be evaluated.
Alerts for Receiving Signals:
This script allows you to set up buy and sell alerts via TradingView's alert system. These alerts are triggered when trend changes are detected based on the conditions coded in the script. Traders can receive instant notifications, allowing them to make decisions without needing to constantly monitor the chart.
Additional Considerations:
The percentage change parameter is adjustable and should be configured based on the time frame you are trading on. For longer time frames, it's advisable to use a larger percentage change to avoid false signals.
The use of Hull Moving Averages (HMA) provides a faster and more reactive approach to trend evaluation compared to other moving averages, making it a powerful tool for traders seeking quick reversal signals.
This approach combines the power of Hull Moving Averages with an alert system to improve the trader’s response to trend changes.
Spanish
Este script, titulado "Reflected EMA Difference (RED)", está fundamentado en la lógica de evaluar el porcentaje de acercamiento y distancia entre dos medias móviles, específicamente las medias móviles de Hull (HMA), para tomar decisiones sobre el valor del precio. El creador de la media móvil de Hull, Alan Hull, diseñó este indicador para ofrecer una forma más rápida y precisa de analizar tendencias de mercado, y en este script se utiliza su concepto como base para medir y reflejar las variaciones de precio.
Descripción del funcionamiento:
Medias Móviles de Hull (HMA): Se utilizan dos HMAs, una de corto plazo y otra de largo plazo. La idea principal es calcular la diferencia Delta entre estas dos medias móviles, que representa cuánto se están alejando o acercando entre sí. Esta diferencia es clave para identificar cambios potenciales en la tendencia del mercado.
Valor Reflejado de la HMA: Con la diferencia Delta calculada entre las HMAs, se refleja el valor de la HMA corta, creando un punto de referencia visual que ayuda a los traders a observar la relación entre el precio y las HMAs en el gráfico.
Índice de Cambio de Porcentaje: El segundo parámetro clave del script es el índice de cambio porcentual. Este define el momento en que una tendencia está revirtiendo, permitiendo establecer órdenes de compra o venta en función de un cambio significativo en la relación entre las HMAs y el precio.
Multiplicador Delta: El script tiene un multiplicador predeterminado de 2 para el cálculo de la diferencia Delta, lo que permite ajustar la sensibilidad del análisis según la temporalidad del gráfico.
Señales de Reversión de Tendencia: Cuando el precio cruza los límites definidos por el índice de cambio porcentual, se emiten señales para comprar o vender, basadas en la detección de una posible reversión de tendencia.
Visualización con Cajas: Se dibujan cajas en el gráfico cuando el indicador HullMA cruza el valor reflejado de la HMA, ayudando a identificar visualmente los momentos críticos en los que se debe evaluar el riesgo de las operaciones.
Alertas para Recibir Señales:
Este script permite configurar alertas de compra y venta desde el apartado de alertas de TradingView. Estas alertas se activan cuando se detectan cambios de tendencia en función de las condiciones establecidas en el código. El trader puede recibir notificaciones instantáneas, lo que facilita la toma de decisiones sin necesidad de estar constantemente observando el gráfico.
Consideraciones adicionales:
El porcentaje de cambio es un parámetro ajustable y debe configurarse según la temporalidad que se esté operando. En temporalidades más largas, es recomendable usar un porcentaje de cambio mayor para evitar señales falsas.
La utilización de las medias móviles de Hull (HMA) proporciona un enfoque más rápido y reactivo para evaluar tendencias en comparación con otras medias móviles, lo que lo convierte en una herramienta poderosa para traders que buscan señales rápidas de reversión.
Este enfoque combina la potencia de las medias móviles de Hull con un sistema de alertas que mejora la reactividad a cambios de tendencia.
Uptrick: MultiTrend Squeeze System**Uptrick: MultiTrend Squeeze System Indicator: The Ultimate Trading Tool for Precision and Versatility 📈🔥**
### Introduction
The MultiTrend Squeeze System is a powerful, multi-faceted trading indicator designed to provide traders with precise buy and sell signals by combining the strengths of multiple technical analysis tools. This script isn't just an indicator; it's a comprehensive trading system that merges the power of SuperTrend, RSI, Volume Filtering, and Squeeze Momentum to give you an unparalleled edge in the market. Whether you're a day trader looking for short-term opportunities or a swing trader aiming to catch longer-term trends, this indicator is tailored to meet your needs.
### Key Features and Unique Aspects
1. **SuperTrend with Dynamic Adjustments 📊**
- **Adaptive SuperTrend Calculation:** The SuperTrend is a popular trend-following indicator that adjusts dynamically based on market conditions. It uses the Average True Range (ATR) to calculate upper and lower bands, which shift according to market volatility. This script takes it further by combining it with the RSI and Volume filtering to provide more accurate signals.
- **Direction Sensitivity:** The SuperTrend here is not static. It adjusts based on the direction of the previous SuperTrend value, ensuring that the indicator remains relevant even in choppy markets.
2. **RSI Integration for Overbought/Oversold Conditions 💹**
- **RSI Calculation:** The Relative Strength Index (RSI) is incorporated to identify overbought and oversold conditions, adding an extra layer of precision. This helps in filtering out false signals and ensuring that trades are taken only in optimal conditions.
- **Customizable RSI Settings:** The RSI settings are fully customizable, allowing traders to adjust the RSI length and the overbought/oversold levels according to their trading style and market.
3. **Volume Filtering for Enhanced Signal Confirmation 📉**
- **Volume Multiplier:** This unique feature integrates volume analysis, ensuring that signals are only generated when there is sufficient market participation. The Volume Multiplier can be adjusted to filter out weak signals that occur during low-volume periods.
- **Optional Volume Filtering:** Traders have the flexibility to turn the volume filter on or off, depending on their preference or market conditions. This makes the indicator versatile, allowing it to be used across different asset classes and market conditions.
4. **Squeeze Momentum Indicator (SMI) for Market Pressure Analysis 💥**
- **Squeeze Detection:** The Squeeze Momentum Indicator detects periods of market compression and expansion. This script goes beyond the traditional Bollinger Bands and Keltner Channels by incorporating true range calculations, offering a more nuanced view of market momentum.
- **Customizable Squeeze Settings:** The lengths and multipliers for both Bollinger Bands and Keltner Channels are customizable, giving traders the flexibility to fine-tune the indicator based on their specific needs.
5. **Visual and Aesthetic Customization 🎨**
- **Color-Coding for Clarity:** The indicator is color-coded to make it easy to interpret signals. Bullish trends are marked with a vibrant green color, while bearish trends are highlighted in red. Neutral or unconfirmed signals are displayed in softer tones to reduce noise.
- **Histogram Visualization:** The primary trend direction and strength are displayed as a histogram, making it easy to visualize the market's momentum at a glance. The height and color of the bars provide immediate feedback on the strength and direction of the trend.
6. **Alerts for Real-Time Trading 🚨**
- **Custom Alerts:** The script is equipped with custom alerts that notify traders when a buy or sell signal is generated. These alerts can be configured to send notifications through various channels, including email, SMS, or directly to the trading platform.
- **Immediate Reaction:** The alerts are triggered based on the confluence of SuperTrend, RSI, and Volume signals, ensuring that traders are notified only when the most robust trading opportunities arise.
7. **Comprehensive Input Customization ⚙️**
- **SuperTrend Settings:** Adjust the ATR length and factor to control the sensitivity of the SuperTrend. This allows you to adapt the indicator to different market conditions, whether you're trading a volatile cryptocurrency or a more stable stock.
- **RSI Settings:** Customize the RSI length and thresholds for overbought and oversold conditions, enabling you to tailor the indicator to your specific trading strategy.
- **Volume Settings:** The Volume Multiplier and the option to toggle the volume filter provide an additional layer of customization, allowing you to fine-tune the indicator based on market liquidity and participation.
- **Squeeze Momentum Settings:** The lengths and multipliers for Bollinger Bands and Keltner Channels can be adjusted to detect different levels of market compression, providing flexibility for both short-term and long-term traders.
### How It Works: A Deep Dive Into the Mechanics 🛠️
1. **SuperTrend Calculation:**
- The SuperTrend is calculated using the ATR, which measures market volatility. The indicator creates upper and lower bands around the price, adjusting these bands based on the current level of market volatility. The direction of the trend is determined by the position of the price relative to these bands.
- The script enhances the standard SuperTrend by ensuring that the bands do not flip-flop too quickly, reducing the chances of false signals in a choppy market. The direction is confirmed by checking the position of the close relative to the previous band, making the trend detection more reliable.
2. **RSI Integration:**
- The RSI is calculated over a customizable length and compared to user-defined overbought and oversold levels. When the RSI crosses below the oversold level, and the SuperTrend indicates a bullish trend, a buy signal is generated. Conversely, when the RSI crosses above the overbought level, and the SuperTrend indicates a bearish trend, a sell signal is triggered.
- The combination of RSI with SuperTrend ensures that trades are only taken when there is a strong confluence of signals, reducing the chances of entering trades during weak or indecisive market phases.
3. **Volume Filtering:**
- The script calculates the average volume over a 20-period simple moving average. The volume filter ensures that buy and sell signals are only valid when the current volume exceeds a multiple of this average, which can be adjusted by the user. This feature helps filter out weak signals that might occur during low-volume periods, such as just before a major news event or during after-hours trading.
- The volume filter is particularly useful in markets where volume spikes are common, as it ensures that signals are only generated when there is significant market interest in the direction of the trend.
4. **Squeeze Momentum:**
- The Squeeze Momentum Indicator (SMI) adds a layer of market pressure analysis. The script calculates Bollinger Bands and Keltner Channels, detecting when the market is in a "squeeze" — a period of low volatility that typically precedes a significant price move.
- When the Bollinger Bands are inside the Keltner Channels, the market is in a squeeze (compression phase). This is often a precursor to a breakout or breakdown. The script colors the histogram bars black during this phase, indicating a potential for a strong move. Once the squeeze is released, the bars are colored according to the direction of the SuperTrend, signaling a potential entry point.
5. **Integration and Signal Generation:**
- The script brings together the SuperTrend, RSI, Volume, and Squeeze Momentum to generate highly accurate buy and sell signals. A buy signal is triggered when the SuperTrend is bullish, the RSI indicates oversold conditions, and the volume filter confirms strong market participation. Similarly, a sell signal is generated when the SuperTrend is bearish, the RSI indicates overbought conditions, and the volume filter is met.
- The combination of these elements ensures that the signals are robust, reducing the likelihood of entering trades during weak or indecisive market conditions.
### Practical Applications: How to Use the MultiTrend Squeeze System 📅
1. **Day Trading:**
- For day traders, this indicator provides quick and reliable signals that can be used to enter and exit trades multiple times within a day. The volume filter ensures that you are trading during the most liquid times of the day, increasing the chances of successful trades. The Squeeze Momentum aspect helps you catch breakouts or breakdowns, which are common in intraday trading.
2. **Swing Trading:**
- Swing traders can use the MultiTrend Squeeze System to identify longer-term trends. By adjusting the ATR length and factor, you can make the SuperTrend more sensitive to catch longer-term moves. The RSI and Squeeze Momentum aspects help you time your entries and exits, ensuring that you get in early on a trend and exit before it reverses.
3. **Scalping:**
- For scalpers, the quick signals provided by this system, especially in combination with the volume filter, make it easier to take small profits repeatedly. The histogram bars give you a clear visual cue of the market's momentum, making it easier to scalp effectively.
4. **Position Trading:**
- Even position traders can benefit from this indicator by using it to confirm long-term trends. By adjusting the settings to less sensitive parameters, you can ensure that you are only entering trades when a strong trend is confirmed. The Squeeze Momentum indicator will help you stay in the trade during periods of consolidation, waiting for the next big move.
### Conclusion: Why the MultiTrend Squeeze System is a Game-Changer 🚀
The MultiTrend Squeeze System is not just another trading indicator; it’s a comprehensive trading strategy encapsulated within a single script. By combining the power
of SuperTrend, RSI, Volume Filtering, and Squeeze Momentum, this indicator provides a robust and versatile tool that can be adapted to various trading styles and market conditions.
**Why is it Unique?**
- **Multi-Dimensional Analysis:** Unlike many other indicators that rely on a single data point or calculation, this script incorporates multiple layers of analysis, ensuring that signals are based on a confluence of factors, which increases their reliability.
- **Customizability:** The vast range of input settings allows traders to tailor the indicator to their specific needs, whether they are trading forex, stocks, cryptocurrencies, or commodities.
- **Visual Clarity:** The color-coded bars, labels, and signals make it easy to interpret the market conditions at a glance, reducing the time needed to make trading decisions.
Whether you are a novice trader or an experienced market participant, the MultiTrend Squeeze System offers a powerful toolset to enhance your trading strategy, reduce risk, and maximize your potential returns. With its combination of trend analysis, momentum detection, and volume filtering, this indicator is designed to help you trade with confidence and precision in any market condition.

The GOD's EYE V1Here's a description for your script that aligns with the guidelines provided:
---
**Title:** The GOD's EYE V1
**Description:**
"The GOD's EYE V1" is a powerful technical analysis tool designed for Forex traders who seek to identify high-probability trading opportunities based on price action and trend-following strategies.
**Key Features:**
1. **Dynamic Channel with Upper and Lower Bands:**
- The script uses a custom EMA-based channel to identify significant price levels. The upper and lower bands are dynamically calculated by adjusting the central EMA line with a fixed pip distance, providing a clear visual of potential support and resistance zones.
2. **Engulfing Candle Detection:**
- The script identifies bullish and bearish engulfing patterns, which are key reversal signals. These patterns are used in conjunction with the EMA channel to confirm potential trade entries.
- **Bullish Engulfing:** Triggered when a bearish candle is followed by a bullish candle that engulfs the previous candle's body, combined with the EMA cross above the upper band.
- **Bearish Engulfing:** Triggered when a bullish candle is followed by a bearish candle that engulfs the previous candle's body, combined with the EMA cross below the lower band.
3. **Customizable Parameters:**
- Traders can adjust the EMA length and the distance of the upper and lower lines from the central EMA to tailor the indicator to their specific trading strategy.
4. **Visual and Alert System:**
- The script provides clear visual signals on the chart, marking potential buy and sell opportunities with triangles above or below the candles. Alerts are also integrated to notify traders in real-time when a bullish or bearish engulfing pattern is detected.
**How It Works:**
- The indicator plots two key levels on the chart (Upper and Lower) based on the central EMA. These levels act as dynamic support and resistance.
- When the fast EMA crosses above the upper band and a bullish engulfing pattern is detected, a potential buying opportunity is signaled.
- Conversely, when the fast EMA crosses below the lower band and a bearish engulfing pattern is detected, a potential selling opportunity is signaled.
**Usage:**
- This indicator is designed for traders who prefer a trend-following approach combined with price action analysis. It is especially useful for those who trade on higher timeframes like the 4H or 1H charts.
- The alerts and visual signals help traders to stay on top of potential trades without constantly monitoring the charts.
---
This description provides a clear overview of the indicator, explaining its features, how it works, and how traders can use it effectively. This should meet the publication guidelines for closed-source scripts.

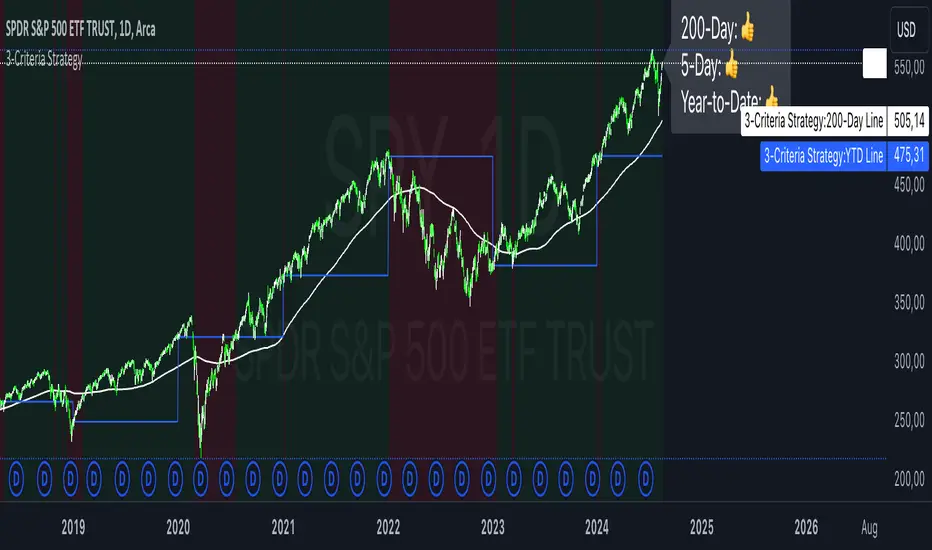
3-Criteria StrategyThe "3-Criteria Strategy" is a simple yet effective trading strategy based on three criteria:
200-Day Moving Average: The first criterion checks whether the current price is above or below the 200-day moving average (SMA). A price above the 200-day line is considered bullish (thumbs up), while a price below is considered bearish (thumbs down).
5-Day Indicator: The second criterion evaluates the performance of the first five trading days of the year. If the closing price on the fifth trading day is higher than the closing price on the last trading day of the previous year, this is considered bullish (thumbs up). Otherwise, it's bearish (thumbs down).
Year-to-Date (YTD) Effect: The third criterion compares the current price with the closing price at the end of the previous year. A current price above the year-end price is bullish (thumbs up), while a price below is bearish (thumbs down).
Signal Interpretation:
Buy Signal: At least two of the three criteria must give a bullish signal (thumbs up).
Sell Signal: Zero or one bullish signal results in a bearish outlook.
The script provides visual cues with background colors:
Green background: Indicates a buy signal.
Red background: Indicates a sell signal.
Additionally, the script plots the 200-day moving average and the YTD line on the chart for better visualization.
Usage:
Apply the Script: Add the script to your TradingView chart.
Interpret Signals: Monitor the background color and the status label to determine trading actions.
Visual Aids: Use the 200-day line and YTD line plotted on the chart to confirm the criteria visually.
Scientific Research
The concepts used in this script—like the 200-day moving average and Year-to-Date effects—are well-documented in financial literature. However, the combination of these specific criteria as a trading strategy is more of a heuristic approach commonly used by traders rather than a subject of extensive academic research.
200-Day Moving Average: The 200-day moving average is widely regarded as a significant level in technical analysis, often serving as a demarcation between long-term bullish and bearish trends. Research has shown that long-term moving averages can be useful for trend-following strategies.
Reference: Brock, W., Lakonishok, J., & LeBaron, B. (1992). Simple Technical Trading Rules and the Stochastic Properties of Stock Returns. Journal of Finance, 47(5), 1731-1764.
Year-to-Date and Calendar Effects: The Year-to-Date effect and early-year performance (such as the January effect) have been studied extensively in the context of seasonal market anomalies.
Reference: Rozeff, M. S., & Kinney, W. R. (1976). Capital Market Seasonality: The Case of Stock Returns. Journal of Financial Economics, 3(4), 379-402.
While these papers don't address the exact combination of criteria used in your strategy, they provide a solid foundation for understanding the underlying concepts.
Market Indicator by Atilla YurtsevenThis TradingView script is designed to analyze and visualize market trends by showing the percentage drops from the all-time high (ATH) of a stock or any other financial instrument. It also calculates and displays key statistical levels such as the mean, median, and various percentage thresholds. This indicator helps traders identify significant retracement levels and possible support/resistance zones based on historical price movements.
Indicator Settings:
- The indicator is named "Market // Atilla Yurtseven" and can be overlaid on the price chart.
- Users can choose to use the closing price (Use Close Price) or the high/low prices.
- Options are provided to show the ATH, ATL (All-Time Low), mean, median, and various minor and macro percentage levels.
Color Customization:
- The script allows customization of text and line colors for different levels, making it adaptable to different charting styles.
Initial Variable Setup:
- The script initializes several variables, including ATH, ATL, and arrays to store price data.
The round and roundy functions are used to format the values for display purposes.
ATH/ATL Calculation:
- The script checks if the current price exceeds the previous ATH and updates the ATH accordingly.
- Similarly, the script calculates the ATL based on the lowest point after reaching the ATH.
Mean and Median Calculation:
- The mean is calculated as the average drop from the ATH, while the median is the middle value in the sorted array of drops.
- These statistics provide insight into the overall trend and are used to identify significant price levels.
Plotting the Levels:
The script plots the ATH, ATL, mean, median, and various percentage retracement levels (12.5%, 25%, 37.5%, etc.).
The levels are color-coded based on user preferences, making it easier to interpret the chart visually.
Labels and Text Display:
- The script dynamically creates and updates labels on the chart to show the values of the ATH, ATL, mean, median, and other key levels.
- This feature allows traders to see at a glance how far the current price is from these critical levels.
Hit Detection:
- The script includes logic to detect if the price is within the range of the mean and median. If the price is within this range, the color of the fill between these levels changes, highlighting this area on the chart.
This script is a powerful tool for traders who want to analyze the retracement levels from historical highs. By displaying the mean, median, and various percentage levels, it provides a comprehensive view of potential support and resistance areas, helping traders make more informed decisions. The customizable nature of the script allows it to fit seamlessly into different trading strategies and charting styles.
Disclaimer:
This script is provided for informational and educational purposes only and does not constitute financial or investment advice. The author, Atilla Yurtseven, is not responsible for any financial losses or damages that may occur as a result of using this script. Trading and investing in financial markets involve risk, and past performance is not indicative of future results. Users should conduct their own research and consult with a qualified financial advisor before making any investment decisions. Use this script at your own risk.
Trade smart, stay safe.
Atilla Yurtseven
